 So. Lets look at the shape of PC1 (ie, contents of
pc01.out), with different training periods.
Thats the graph there on the left, click on it for a bigger version.
The colours are:
So. Lets look at the shape of PC1 (ie, contents of
pc01.out), with different training periods.
Thats the graph there on the left, click on it for a bigger version.
The colours are:
This is a work in progress. If it survives comment over a week or whatever,
I'll consider it reasonably robust. It was started on 2004/11/03.
2004/11/08: still WiP.
2005/03/24: now more of a work-not-in-progress :-( I would slightly emphasise the
importance of autocorrelation in the random noise.
.
As a work in progress, you may like to see earlier versions. Its under rcs, so you can: download index.phtml,v.
Current status:
Open for comment: this page doesn't allow blogging and stuff, however I welcome comments (use the "contact" link). If you want to mail me something intended to be a public comment, then make that clear please: unless you say otherwise I will treat you comment as private. Public comments will be put up somewhere. I haven't had any yet.
But lets get on with it... oops, hold on, first: a disclaimer. Although I've now actually read all of MBH98, I wouldn't say I've fully digested it. I don't think I need to for the purposes of whats below, though.
M&M say that MBH is fatally flawed for any number of reasons - see Tim Lamberts handy guide for some of them. But the one I am looking at here is the one they lay out here (pdf) and perhaps here (warming: lots of extraneous stuff) and which was popularised by Muller.
My summary of their idea is that by doing standardisation over the 1902-1980 period (this is referred to as the "training period"), the MBH procedure has a built-in bias towards producing curves which have a trend over the last century. The idea is plausible (and M&M believe that they have proved it) but:
Now another caveat. As I understand it, MBH use the PCA/EOF (actually SVD) procedure to reduce a large number of obs down to their principle components. Then, from (some of?) these PC's, a series for that region is constructed. So what I'm going to do is look at the PC's that come out of the program. Since PC1 looks like a 20C warming, and PC2 (and on) look like "noise" (or at least, trendless) I'm going to assume that we are mainly interested in PC1 and that the shape of PC1 is most of the issue.
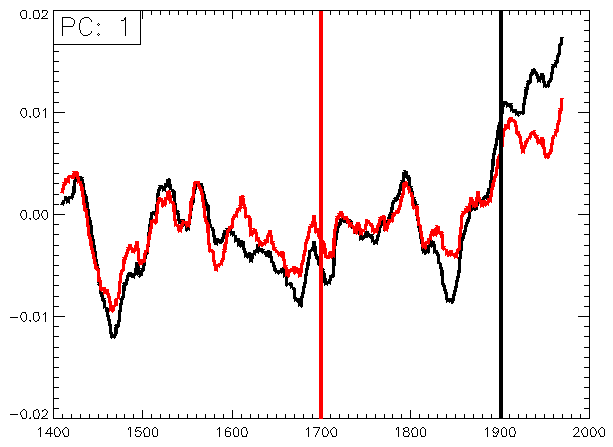
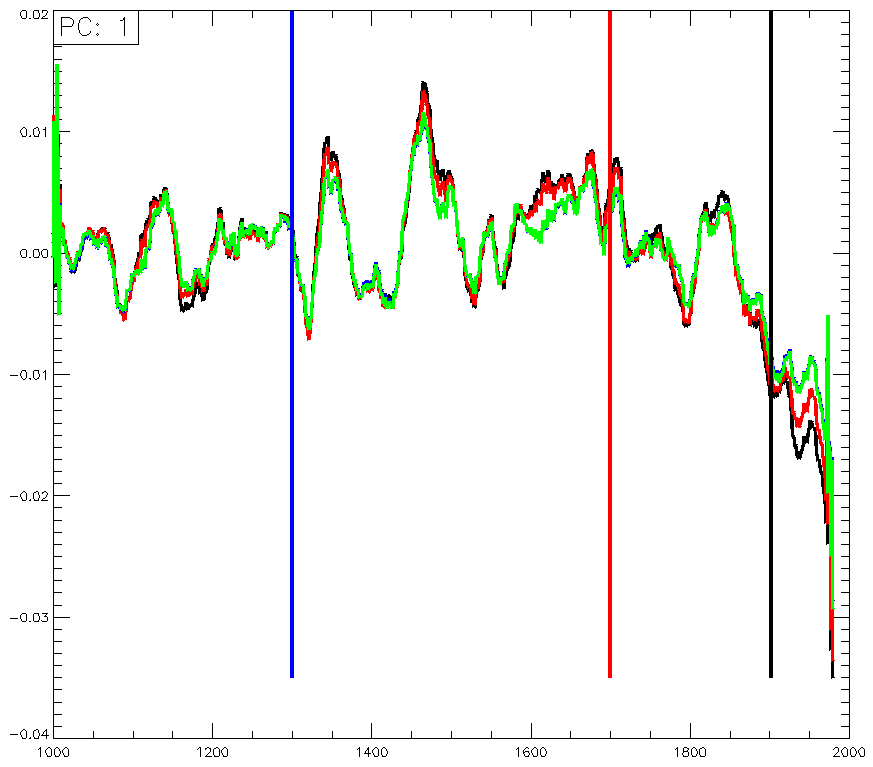
So. Lets look at the shape of PC1 (ie, contents of
pc01.out), with different training periods.
Thats the graph there on the left, click on it for a bigger version.
The colours are:
The Green period effectively uses all the data for the training period, except the first 2 points (I did that just in case the code fails with null points outside the training period, but I didn't test that). The black is the MBH standard. Red and Blue are intermediate. I sound a slight note of caution here: I find the curves almost too similar... I expected more differences... but you can check the code in the "files" section at the bottom if you want to.
So, assuming that I've done the coding right, we see that *all* training periods produce the familiar temperature curve (err, of course, its upside down: I think that is because the PC's are indeterminate wrt sign; and of course this is just one region (north america?) so is allow to be different from the full curve).
But the important point is that, although the curves differ, there is no sign at all of the red curve starting to show trends at 1702; or the blue at 1302; or the green from the beginning. And thats what you would expect from M&M's argument.
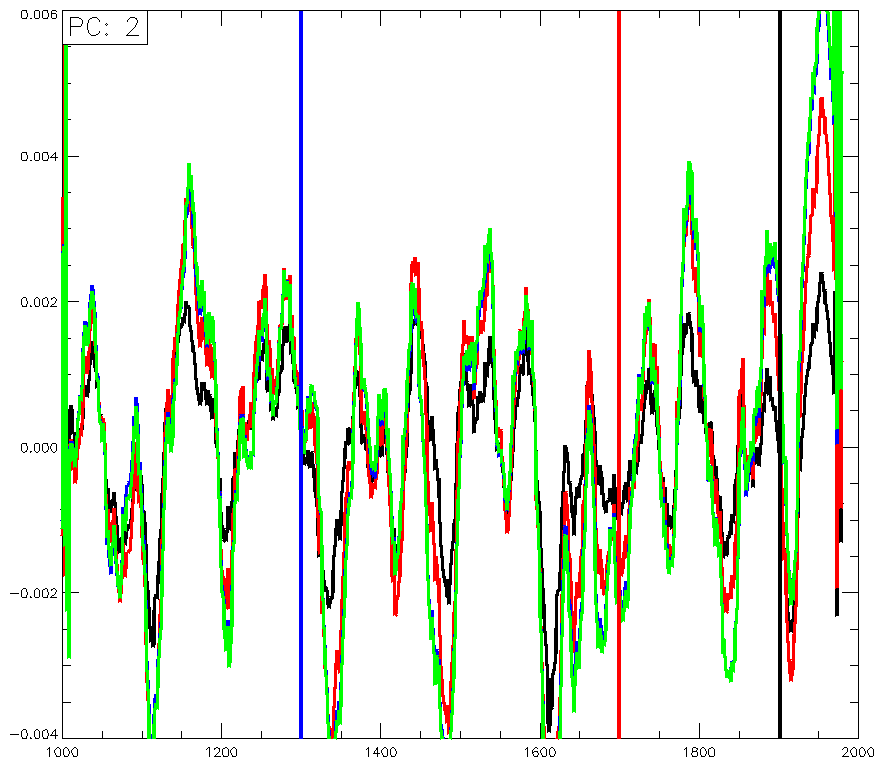
Now, look at the pic on the right, which is PC2. This is mostly trendless and looks more like "noise". Again, the shapes of all the curves are very similar. Actually there are hints of a 20C trend especially in the green/blue and rather lesser in the red versions. Possibly some leakage from PC1?
You'll also notice that the PC2's are of different magnitudes. Well, yes. This exposes a gap in my knowledge. The PC1's above have been plotted scaled by the first eigenvalue (which is 0.5522 for std; 0.2867 for 1702-; 0.2317 for 1302-; 0.2357 for 1002- (oh, and they have been scaled to zero mean for plotting too)). The second have been plotted scaled by the second evalue, naturally enough. They are: 0.0796; 0.1228; 0.1208 and 0.0753. I expected them to overlie, but they don't. They overlie better if they *aren't* scaled. If anyone can explain this, please let me know. Its possible that we care nothing for the absolute values but only the shape; in which case it doesn't matter.
Err... well there you have it. If I'm right, M&M are wrong, at least
for this part of their argument.
Update: they *have* put up their code (thanks McI). See www.climate2003.com/data/MM04c/script2.txt and also some new additions to climate2003.
[Page last modified: 24/3/2005] [Home] Page proudly created with vi... or vim... or...